Task2Box: Box Embeddings for Modeling Asymmetric Task Relationships
University of Massachusetts Amherst
[arXiv][CVPR24]
(CVPR 2024 Highlight)
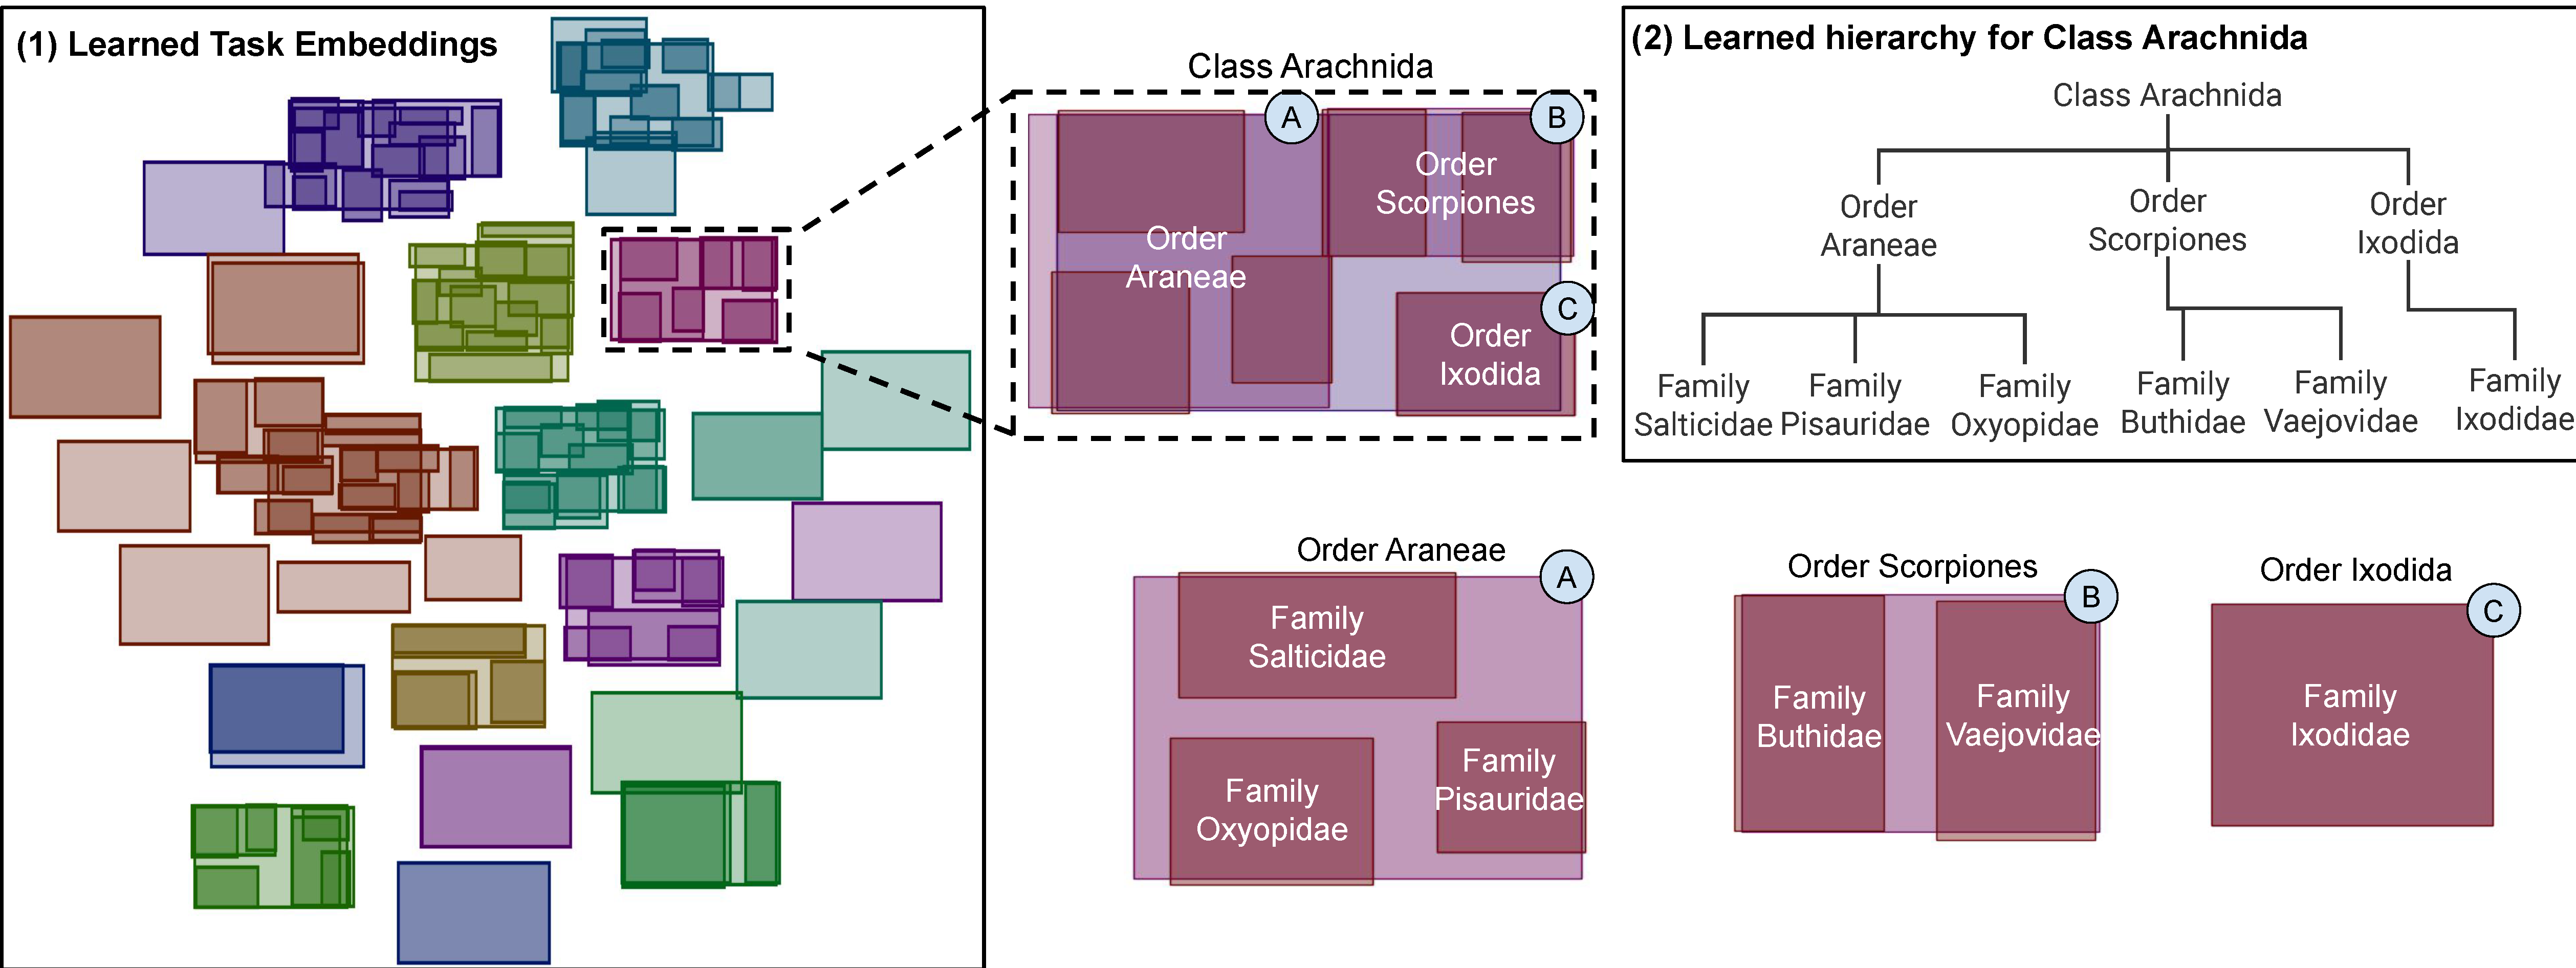
 Fig 1: Box embeddings of 150 datasets of iNaturalist + CUB and corresponding learned hierarchy for Class Arachnida. Each taxonomic category is treated as a separate dataset for which Task2Box embeddings are learned. (1) Shows the learned box embeddings where datasets from the same group (taxonomic class) have the same color. Datasets naturally cluster to their ground truth groups. (2) Shows the hierarchy learned through Task2Box for a specific class. The hierarchy matches the ground truth relationships based on biological classification. Orders that belong to Class Arachnida are learned as boxes (A, B, C) contained by the larger box for Arachnida; families under each of the orders are learned as smaller boxes contained by the corresponding orders they belong to.
Overview
Modeling and visualizing relationships between tasks or datasets is an important step towards solving various meta-tasks such as dataset discovery, multi-tasking, and transfer learning. However, many relationships (e.g., containment or transferability) are naturally asymmetric and current approaches for representation and visualization (e.g., t-SNE) do not readily support this. We propose Task2Box, an approach to represent tasks using box embeddings—axis-aligned hyperrectangles in low dimensional spaces–that can capture asymmetric relationships between tasks through volumetric overlaps. We show that Task2Box accurately predicts unseen hierarchical relationships between nodes in ImageNet and iNaturalist datasets, as well as transferability between tasks in the Taskonomy benchmark. We also show that box embeddings estimated from task representations (e.g., CLIP, Task2Vec, or attribute based ) can be used to predict relationships between unseen tasks more accurately than classifiers trained on the same representations, as well as handcrafted asymmetric distances (e.g., KL divergence). This suggests that low-dimensional box embeddings can effectively capture these task relationships and have the added advantage of being interpretable. We use the approach to visualize task relationships, and model image classification datasets on Hugging Face.
Key Idea
The success of deep learning has led to the proliferation of datasets for solving a wide range of computer vision problems. Yet, there are few tools available to enable practitioners to find datasets related to the task at hand, and to solve various meta-tasks related to it. We present Task2Box, a method to represent tasks using axis-aligned hyperrectangles (or box embeddings). Task2Box is framed as a learnable mapping from dataset representation to boxes, and can be trained to predict various relationships between novel tasks such as transferability, hierarchy, and overlap.
We test our framework to model relationships between nodes in iNaturalist, CUB and ImageNet datasets, as well as to predict transferability on the Taskonomy benchmark. Table 1 and 2 show that low-dimensional box embeddings accurately predicts novel relationships between datasets seen during training, as well as relationships with novel datasets. Remarkably, Task2Box outperforms classifiers trained to directly predict the relationships on the same representations, suggesting that the box embedding provides a good inductive bias for learning hierarchical relationships. We also outperform simple asymmetric distances proposed in prior work such as Kullback-Leibler (KL) divergence. To model the heterogeneous tasks in the Taskonomy benchmark we map each task to a set of attributes from which a box embedding is learned. Once again, we obtain significantly higher correlation between the true and predicted transferability for both existing and novel datasets compared to standard classifiers (Table 3). Such attribute-based representations can be readily derived from datasheets and modelcards.
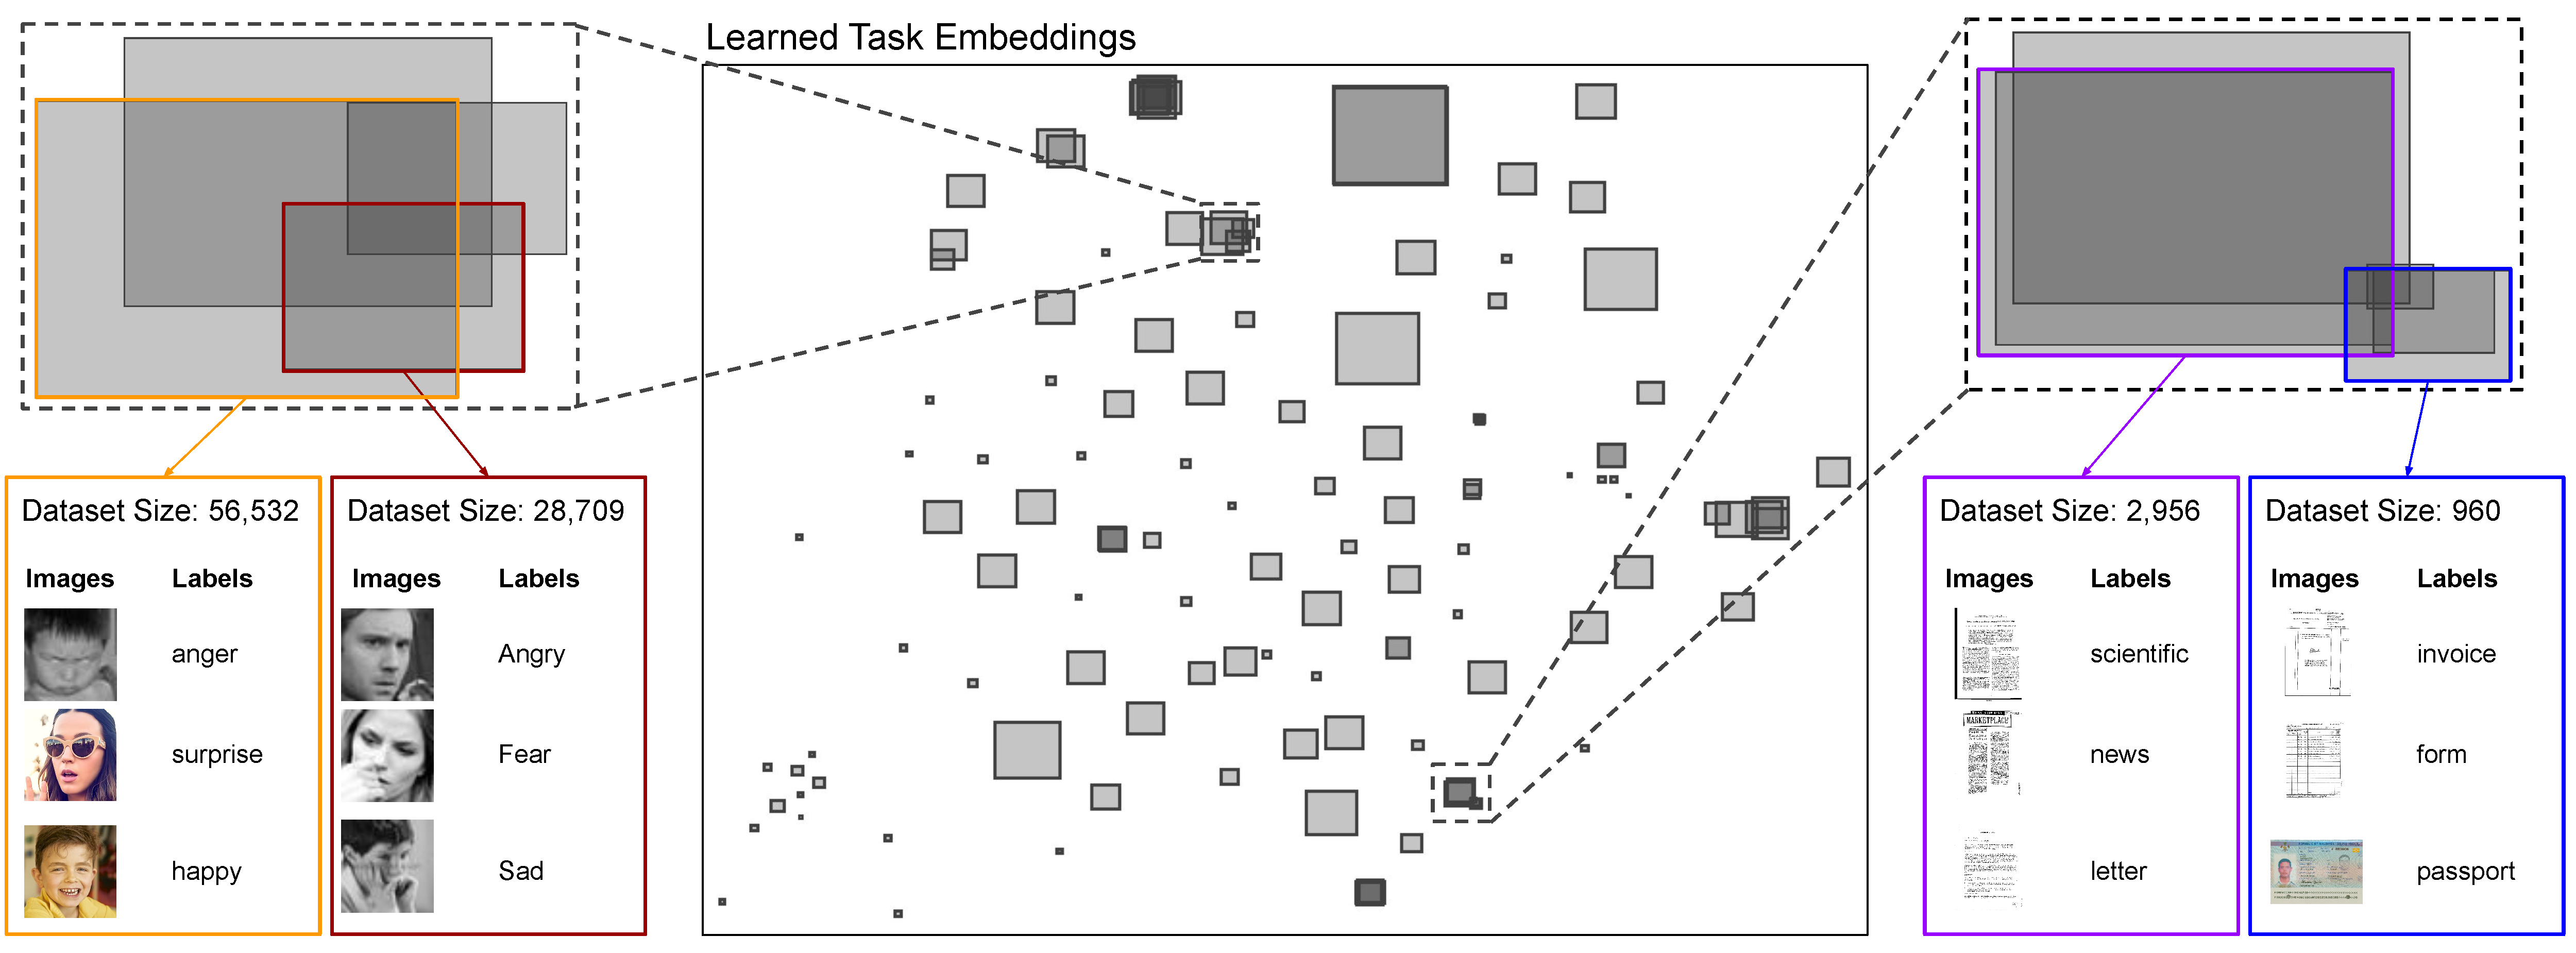
Finally, the low-dimensional box embeddings have the added advantage of being interpretable. Fig. 1 and Fig. 2 show relationships on the iNaturalist+CUB and ImageNet categories, respectively. The 2D box representation allows us to readily visualize the strength and direction of task relationships based on the overlapping volumes, which is not possible using Euclidean representation (e.g., t-SNE). At the same time, new datasets can be embedded in constant time without needing to retrain or reoptimize. We use the framework to visualize overlap relationships among 131 publicly available datasets on Hugging Face (a platform for hosting datasets) in Fig. 3.
| Existing Datasets | Novel Datasets | |||||
|---|---|---|---|---|---|---|
| mean (CLIP) | mean, var (CLIP) | FIM | mean (CLIP) | mean, var (CLIP) | FIM | |
| Task2Box (2D) | 69.23% | 67.84% | 39.61% | 50.07% | 39.66% | 10.06% |
| Task2Box (3D) | 79.66% | 79.35% | 57.63% | 70.04% | 64.53% | 20.65% |
| Task2Box (5D) | 84.67% | 82.41% | 79.72% | 73.79% | 72.11% | 34.88% |
| MLP Classifier | 45.25% | 61.45% | 26.34% | 39.06% | 44.54% | 19.90% |
| Linear Classifier | 4.40% | 3.11% | 7.06% | 4.77% | 5.87% | 15.92% |
| KL Divergence | - | 6.58% | 7.94% | - | 5.90% | 0.00% |
| Asymmetric Cosine | 9.29% | 11.54% | 2.83% | 1.47% | 1.47% | 1.47% |
| Asymmetric Euclidean | 1.71% | 1.71% | 8.53% | 1.47% | 1.47% | 1.91% |
| Random | 2.06% | 2.06% | 2.06% | 1.49% | 1.49% | 1.49% |
Table 1: Average F1 Score for predicting hierarchical relationships on iNaturalist + CUB.
| Existing Datasets | Novel Datasets | |||||
|---|---|---|---|---|---|---|
| mean (CLIP) | mean, var (CLIP) | FIM | mean (CLIP) | mean, var (CLIP) | FIM | |
| Task2Box (2D) | 62.72% | 63.33% | 31.32% | 47.76% | 48.35% | 9.46% |
| Task2Box (3D) | 83.12% | 82.79% | 58.16% | 73.06% | 66.48% | 24.70% |
| Task2Box (5D) | 90.58% | 88.48% | 64.91% | 76.95% | 78.84% | 37.39% |
| MLP Classifier | 54.20% | 60.43% | 44.85% | 62.24% | 64.56% | 41.22% |
| Linear Classifier | 9.84% | 8.33% | 25.46% | 11.89% | 11.87% | 22.98% |
| KL Divergence | - | 5.53% | 9.90% | - | 10.41% | 0.00% |
| Asymmetric Cosine | 4.28% | 4.28% | 6.92% | 4.52% | 4.52% | 0.00% |
| Asymmetric Euclidean | 3.73% | 3.73% | 7.16% | 4.52% | 4.52% | 4.73% |
| Random | 3.64% | 3.64% | 3.64% | 5.02% | 5.02% | 5.02% |
Table 2: Average F1 Score for predicting hierarchical relationships on ImageNet instruments.
| Existing Datasets | Novel Datasets | |
|---|---|---|
| Task2Box (2D) | 0.85 +/- 0.06 | 0.12 +/- 0.21 |
| Task2Box (3D) | 0.93 +/- 0.02 | 0.48 +/- 0.24 |
| Task2Box (5D) | 0.94 +/- 0.03 | 0.39 +/- 0.22 |
| MLP | 0.88 +/- 0.06 | 0.31 +/- 0.18 |
| Linear | 0.75 +/- 0.11 | 0.40 +/- 0.24 |
| Random | 0.05 +/- 0.14 | 0.15 +/- 0.07 |
Table 3: Spearman correlation and standard deviation between the predicted and ground truth task affinities from Taskonomy. Our method shows higher correlation with the task affinities compared to other baseline methods.

Fig 2: Visualization of learned embeddings on instrument-related datasets in ImageNet. Datasets that belong to the same superset are shaded in the same color. Task2Box learns the hierarchy of various groups, and clusters similar datasets closer to each other.
 Fig 3: Visualization of relationships between public image classification datasets in Hugging Face. The sample data points annotated on the highlighted datasets show that common tasks overlap with each other (e.g., sentiment classification and document classification datasets). Although labels could slightly differ between datasets, Task2Box can infer the level of similarity and represent it as the amount of overlap. The embedding size (box area) also shows the number of available data.
Code
The code is available at https://github.com/cvl-umass/task2box
BibTeX
@InProceedings{Daroya_2024_CVPR,
    author    = {Daroya, Rangel and Sun, Aaron and Maji, Subhransu},
    title     = {Task2Box: Box Embeddings for Modeling Asymmetric Task Relationships},
    booktitle = {Proceedings of the IEEE/CVF Conference on Computer Vision and Pattern Recognition (CVPR)},
    month     = {June},
    year      = {2024},
    pages     = {28827-28837}
}
Acknowledgements
This work was supported by awards from the National Science Foundation (2329927 and 1749833) and the NASA AIST program. The experiments were performed on the University of Massachusetts GPU cluster funded by the Mass. Technology Collaborative.