COSE: A Consistency-Sensitivity Metric for Saliency on Image Classification
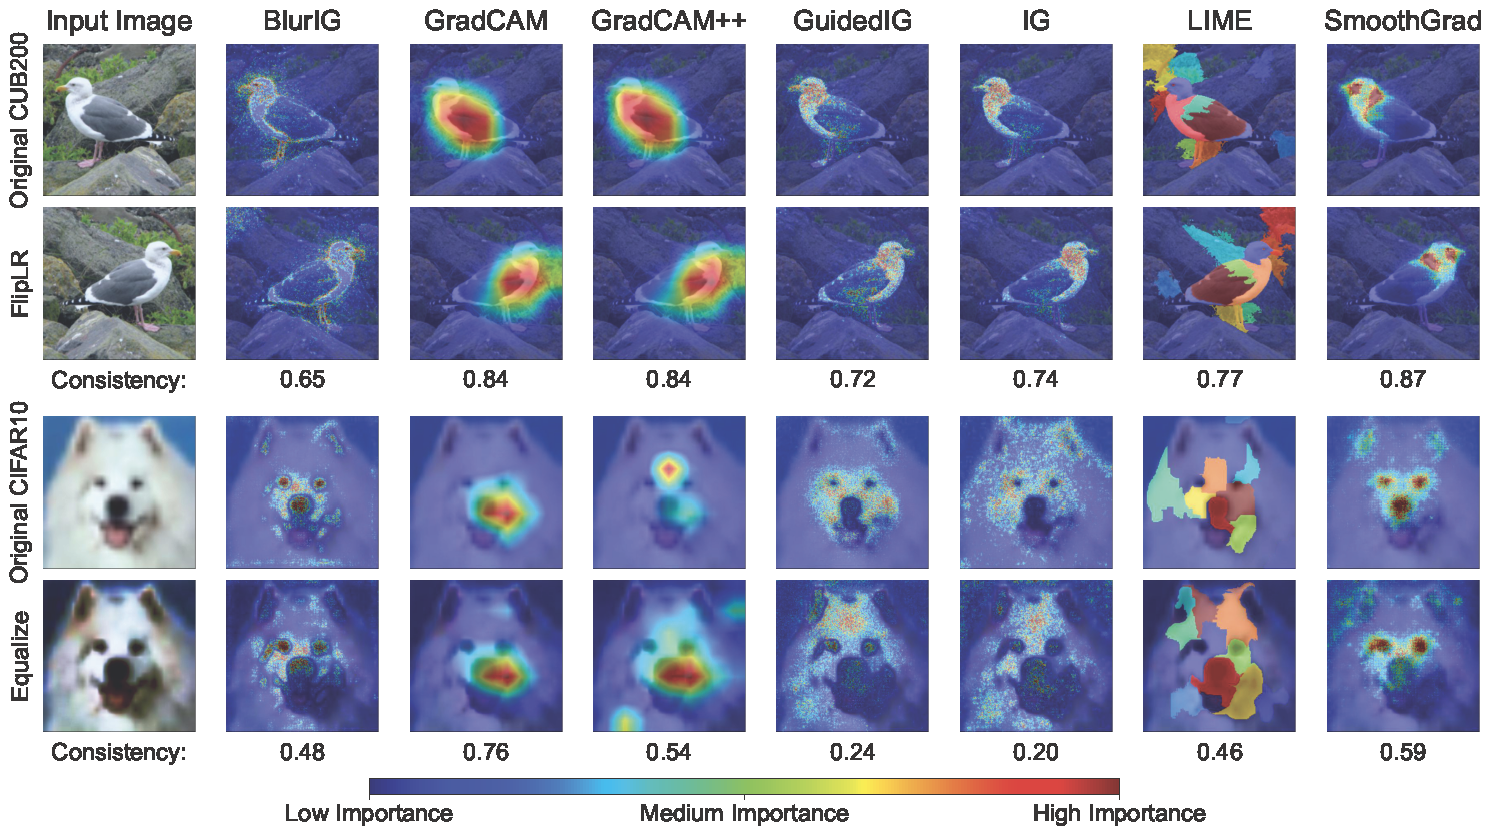 Figure 1: Saliency maps extracted from a ResNet50 on CUB200 and CIFAR10 images. The colors indicate pixel importance predicted by different methods (blue=low; red=high). We show two sample data transformations: FlipLR (geometric transformation) and Equalize (photometric transformation). GradCAM is consistently focuses on the chest of the bird, despite the left-right flip. Even with image equalization, GradCAM emphasizes the nose of the dog. While other methods appear to do well on FlipLR, they struggle with Equalize. The proposed COnsistency-SEnsitivity (COSE) metric quantifies the equivariant and invariant properties of visual model explanations using simple data augmentations.
Overview
We present a set of metrics that utilize vision priors to effectively assess the performance of saliency methods on image classification tasks. To understand behavior in deep learning models, many methods provide visual saliency maps emphasizing image regions that most contribute to a model prediction. We propose the metric COnsistency-SEnsitivity (COSE) that quantifies the equivariant and invariant properties of visual model explanations using simple data augmentations. Through our metrics, we show that although saliency methods are thought to be architecture-independent, most methods could better explain transformer-based models over convolutional-based models. In addition, GradCAM was found to outperform other methods in terms of COSE but was shown to have limitations such as lack of variability for fine-grained datasets. The duality between consistency and sensitivity allow the analysis of saliency methods from different angles. Ultimately, we find that it is important to balance these two metrics for a saliency map to faithfully show model behavior.
Key Idea
We propose consistency and sensitivity metrics that measure two complementary properties of saliency maps. Consistency refers to the property that saliency maps should remain unchanged when an input is transformed in a way that the model predictions don’t change. For example, when an input is reflected or translated by a small amount, the corresponding saliency maps should also undergo the same geometric transformation, as we do not expect the class predictions to change. Similarly, when the input undergoes a photometric transformation (e.g., change in pixel intensities or blurring), we expect saliency maps to remain identical. In short, consistency captures the degree to which saliency maps are equivariant and invariant to transformations that don’t affect model predictions. Sensitivity refers to the property that saliency maps should change when the model produces a different output. This difference in model output could be a result of changes in the model parameters (e.g., during the process of training the model) or sufficiently large changes in input. Thus, the model’s explanations must change for it to produce a different output. Prior knowledge was used to identify transformations that should result in equivariance and invariance for various computer vision tasks. Figure 2 illustrates these properties where GradCAM is shown to do well in terms of both consistency and sensitivity.
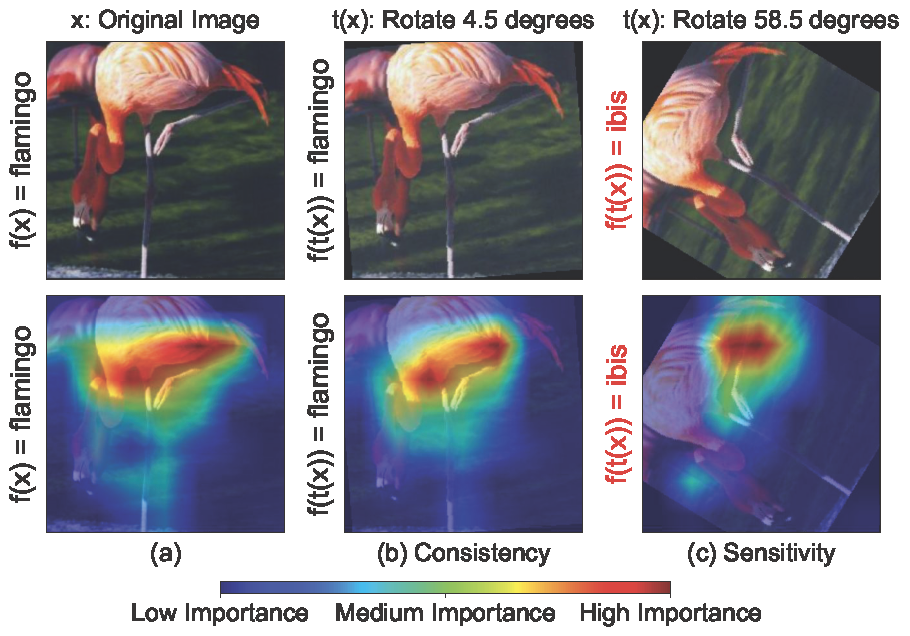 Figure 2: GradCAM consistency and sensitivity to data transformations on ResNet50/Caltech101: the top row shows the input images, and the bottom row shows the corresponding saliency maps. In the reference image (a), the model correctly classifies the original image as a flamingo. (b) displays GradCAM’s consistency as the model correctly classifies the transformed image with a similar saliency map as (a). (c) displays GradCAM’s sensitivity where the model incorrectly classified the transformed image as ibis and the saliency map emphasizes differently from (a)
Results
Below we discuss the key insights from analyzing with COSE across eight models, five datasets, and seven saliency methods.
| Dataset | Model | BlurIG | GradCAM | GradCAM++ | GuidedIG | IG | LIME | SmoothGrad |
|---|---|---|---|---|---|---|---|---|
| Caltech101 | ConvNext | 63.01% | 63.50% | 65.28% | 54.25% | 62.53% | 61.51% | 60.90% |
| ResNet50 | 65.77% | 61.86% | 45.41% | 52.41% | 58.80% | 56.69% | 59.60% | |
| Swin-T | 67.81% | 67.15% | 57.50% | 52.54% | 64.68% | 63.17% | 61.95% | |
| ViT | 69.60% | 68.66% | 60.30% | 57.48% | 66.67% | 61.12% | 66.41% | |
| CIFAR10 | ConvNext | 61.46% | 66.74% | 66.72% | 53.02% | 60.91% | 62.06% | 58.85% |
| ResNet50 | 60.47% | 62.29% | 42.75% | 48.27% | 51.20% | 59.86% | 52.02% | |
| Swin-T | 66.35% | 69.66% | 58.29% | 50.11% | 63.05% | 65.76% | 56.95% | |
| ViT | 66.46% | 71.54% | 59.11% | 55.72% | 66.68% | 63.85% | 61.00% | |
| CUB200 | ConvNext | 54.15% | 60.61% | 59.81% | 59.59% | 61.20% | 56.90% | 47.89% |
| ResNet50 | 58.63% | 44.01% | 40.74% | 56.50% | 60.05% | 55.50% | 52.38% | |
| Swin-T | 62.37% | 62.51% | 49.78% | 60.14% | 64.02% | 59.06% | 56.05% | |
| ViT | 59.07% | 64.80% | 56.65% | 61.26% | 60.42% | 58.31% | 53.70% | |
| EuroSAT | ConvNext | 59.17% | 65.47% | 63.58% | 52.83% | 61.45% | 60.23% | 57.17% |
| ResNet50 | 57.28% | 62.27% | 45.17% | 40.87% | 46.14% | 59.47% | 47.96% | |
| Swin-T | 64.74% | 66.49% | 53.82% | 47.51% | 61.99% | 59.60% | 60.43% | |
| ViT | 67.85% | 70.31% | 57.95% | 57.90% | 68.12% | 60.63% | 62.48% | |
| Oxford102 | ConvNext | 58.60% | 62.78% | 61.74% | 58.73% | 60.71% | 57.23% | 57.77% |
| ResNet50 | 61.13% | 61.90% | 40.30% | 54.93% | 55.07% | 58.32% | 56.60% | |
| Swin-T | 66.57% | 67.38% | 56.87% | 52.86% | 63.42% | 62.06% | 59.41% | |
| ViT | 66.90% | 68.31% | 59.14% | 59.67% | 65.92% | 61.44% | 62.95% | |
| 63.23% | 64.66% | 54.59% | 54.73% | 61.33% | 60.11% | 57.94% |
Table 1: Results of COSE evaluation on saliency methods across different models and datasets. GradCAM is shown to be more reliable than other methods based on COSE.
Transformers have better explanations than ConvNets
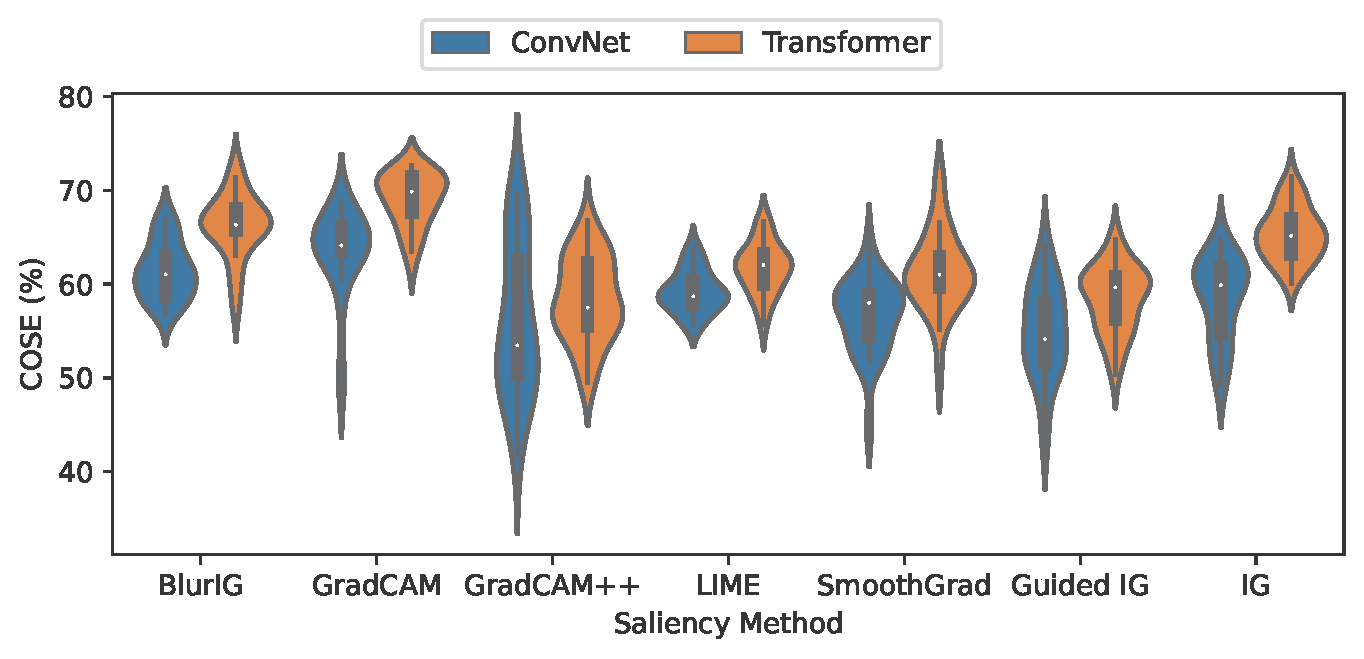 Figure 3: The distributions of COSE for ConvNets and Transformers compared for all saliency methods, shown as a violin plot. Within each violin, the thin line shows the 1.5x interquartile range, the thick line shows the interquartile range, and the white dot shows the median. The shape of the violin shows how data points are distributed. Transformers outperform ConvNets on average for all methods.
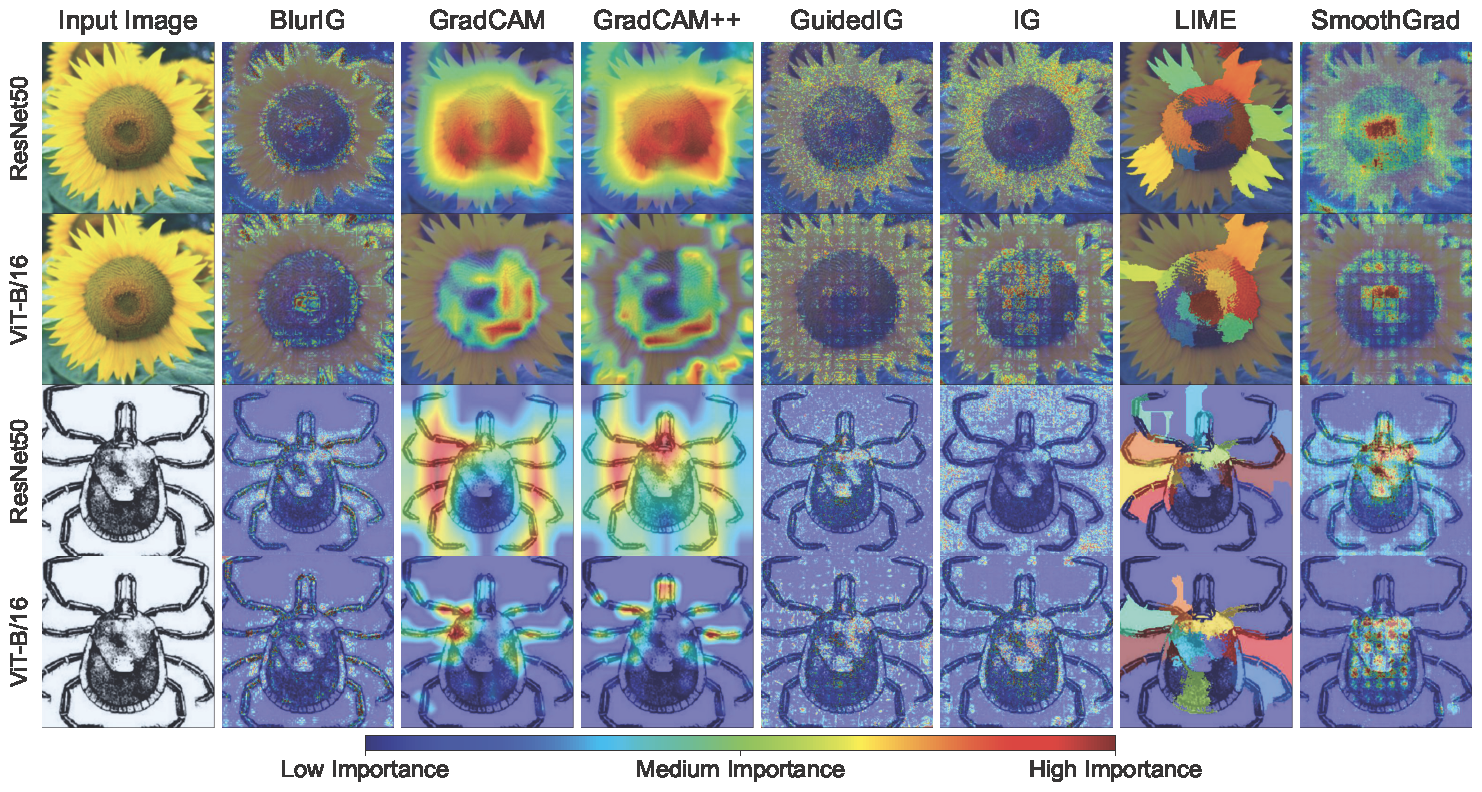 Figure 4: Results of saliency methods on ViT-B/16 (a transformer model), ResNet50 (a convolutional model), and Oxford102/Caltech101. We qualitatively observe the explanations for ViT-B/16 to be similar (Guided IG, SmoothGrad) or better (BlurIG, IG, LIME, GradCAM, GradCAM++). In general, we find transformer model explanations are more coherent than convolutional model explanations.
GradCAM is a reliable saliency method
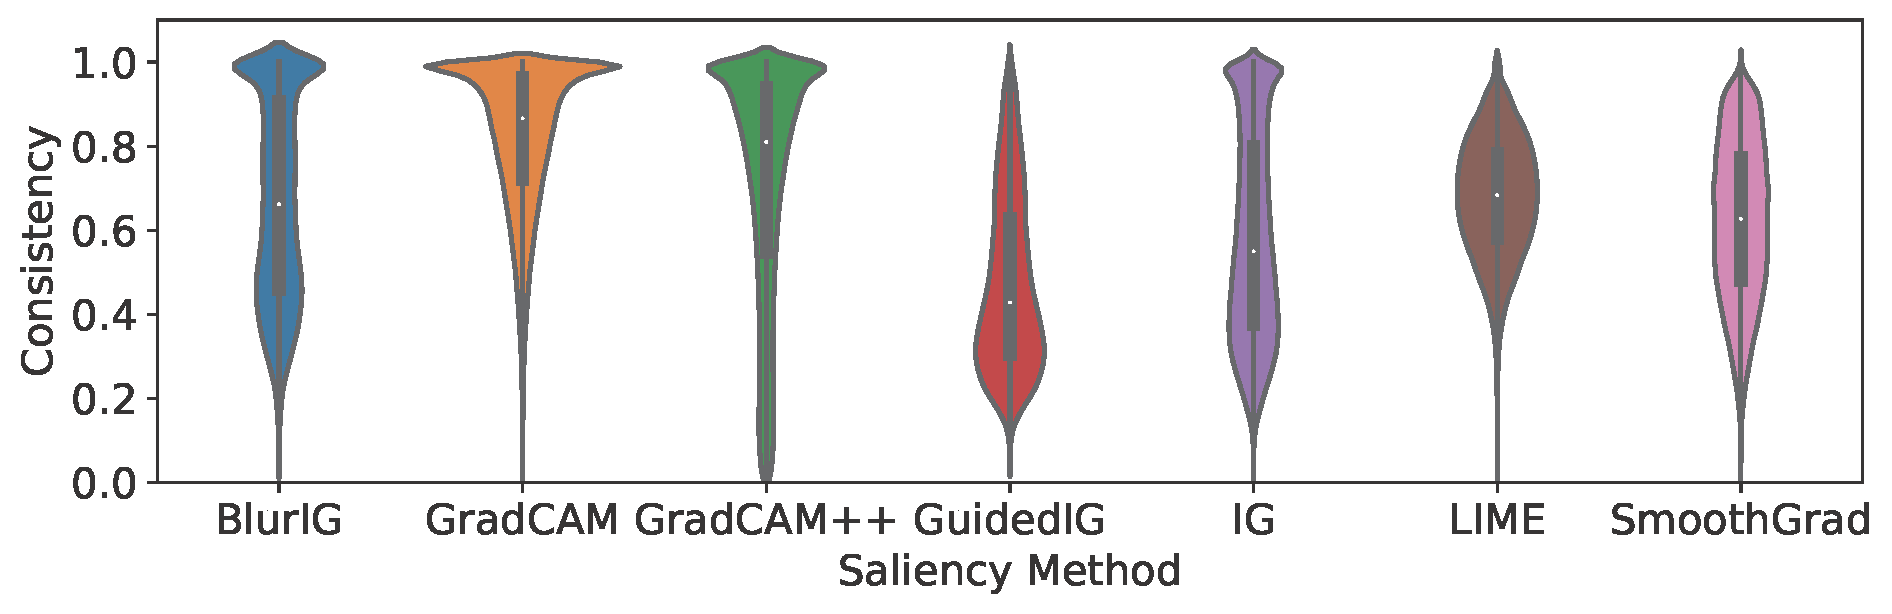 Figure 5: GradCAM has the highest average consistency. We can also observe the distribution of consistency across different samples, with GradCAM having more samples with high consistency.
Existing saliency methods can be improved by balancing consistency and sensitivity
GradCAM is shown to outperform other saliency methods on several angles. However, with a COSE of 64.66%, GradCAM still has areas for improvement. Figure 1 shows that GradCAM tends to predict general areas, which limits its sensitivity to model changes. Due to the large salient area presented, it’s more difficult to isolate differences due to model changes. SmoothGrad and BlurIG show more specific areas, but they tend to be unstable to input perturbations. Future work on saliency methods should aim to balance performance on both - being robust while maintaining good sensitivity.
At the same time, most methods struggle explaining changes related to photometric transformations more than geometric transformations. While COSE gives an overview of overall performance across all transform magnitudes, we recommend saliency method developers consider photometric changes and geometric changes as separate problems while trying to achieve consistency in both.
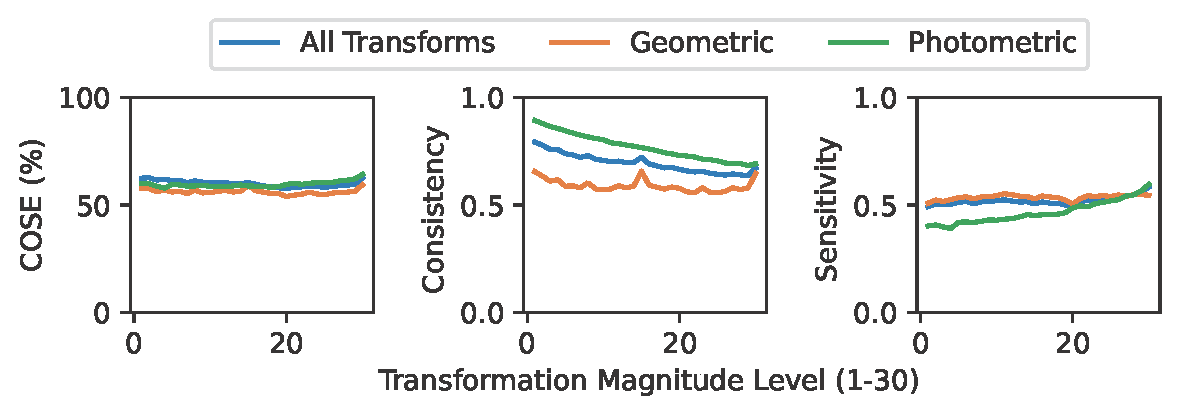 Figure 6: Average performance for all methods on all transformations and separately for geometric and photometric transformations. While photometric transformations have decreasing sensitivity and increasing fidelity as transformation magnitudes increase, geometric transformations seem to have approximately the same performance regardless of transformation magnitude.
Code
The code is available at https://github.com/cvl-umass/COSE
BibTeX
@InProceedings{Daroya_2023_ICCV,
    author    = {Daroya, Rangel and Sun, Aaron and Maji, Subhransu},
    title     = {COSE: A Consistency-Sensitivity Metric for Saliency on Image Classification},
    booktitle = {Proceedings of the IEEE/CVF International Conference on Computer Vision (ICCV) Workshops},
    month     = {October},
    year      = {2023},
    pages     = {149-158}
}
Acknowledgements
The project was funded in part by NSF grant #1749833 to Subhransu Maji. The experiments were performed on the University of Massachusetts GPU cluster funded by the Mass. Technology Collaborative.